With the rapid improvement of people’s life in China, the demand of imported food is increasing year by year, and people’s safety requirement for imported food is also increasing. The General Administration of Quality Supervision, Inspection and Quarantine of the People’s Republic of China (AQSIQ) attaches great importance to the imported food safety, and supervises the imported food strictly. On 29 October 2015, AQSIQ published the report of the quality and safety of imported food in China from 2010 to 2014.
1. The trade of imported food in China from 2010 to 2014
According to the statistics of AQSIQ, during the 5 years from 2010 to 2014, the trade volume of imported food in China nearly doubled, and the average annual growth rate reached 17.4%. In the 5 years, there were total 4,324,000 batches (140 million tons, 200.37 billion dollars) imported food inspected and quarantined by local CIQs.
During the 5 years from 2010 to 2014, China imported food from 213 countries or regions, among them, the top 10 in imported trade volume were: ASEAN, the European Union, America, New Zealand, Brazil, Canada, Russia, Australia, Argentina and South Korea, with a total value of 172.77 billion dollars, which accounted for 84.3 % of the total value; The imported food categories almost covered all kinds of global excellent foods, grease and oil, aquatic products, dairy products, meat, wine, sugar, grain and products, beverage, dry nuts and canned food are the main imported categories, with a total value of 192.14 billion dollars, which accounted for 93.8% of the total value. More detailed information was showed in the following figures (1-4).
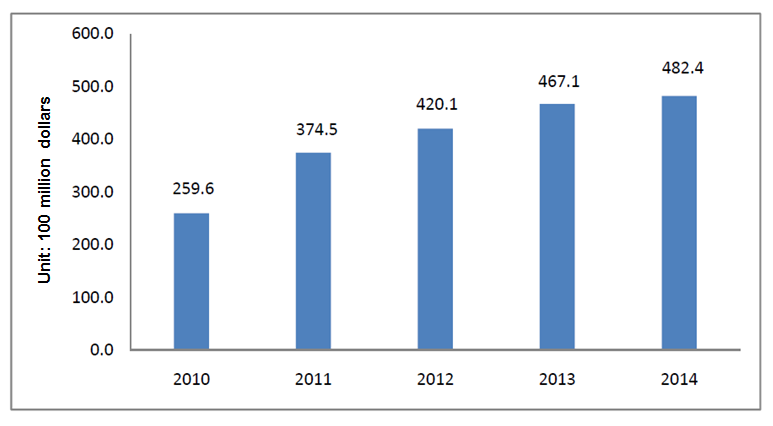
Figure 1 The trade value of imported food in China from 2010 to 2014
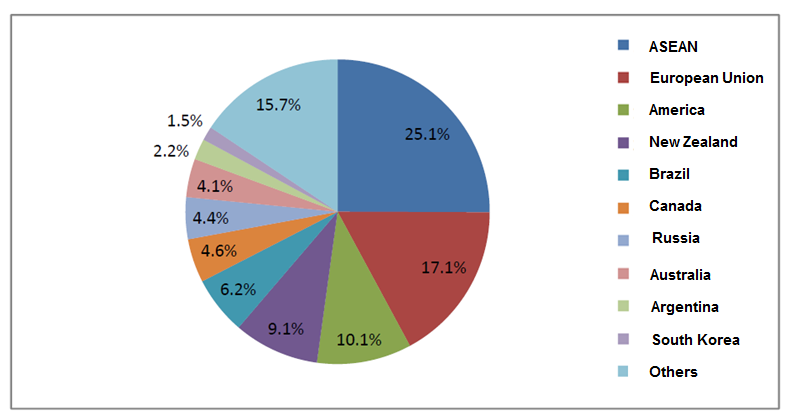
Figure 2 Sources of imported food in China from 2010 to 2014 (calculated in trade volume)
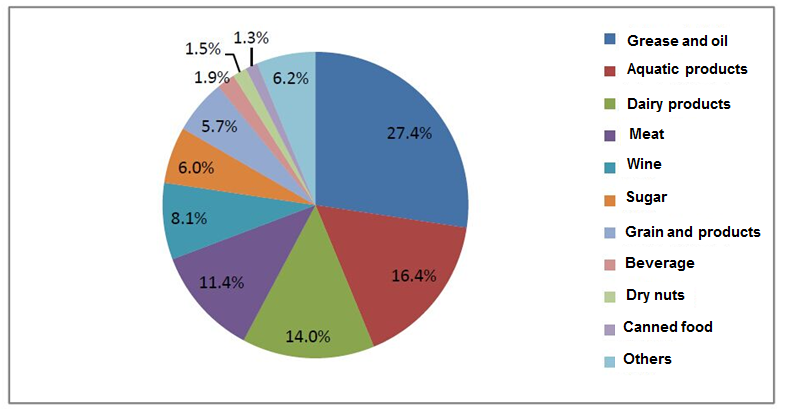
Figure 3 Imported food categories in China from 2010 to 2014 (calculated in trade volume)
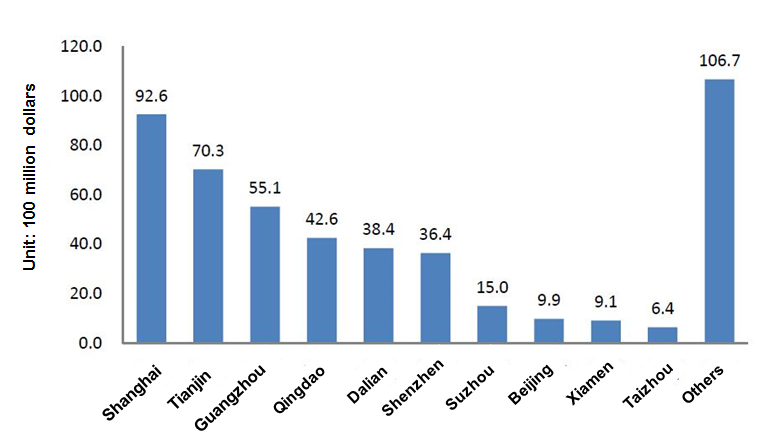
Figure 4 Import ports from 2010 to 2014
The trade of imported food in large amounts from 2010 to 2014
Among all kinds of imported foods, the imported amount of vegetable oil, milk powder, meat, and aquatic products reached 50.838 million tons, 5.434 million tons, 11.757 million tons and 19.328 million tons, respectively. More detailed information was showed in the following figures (5-9).
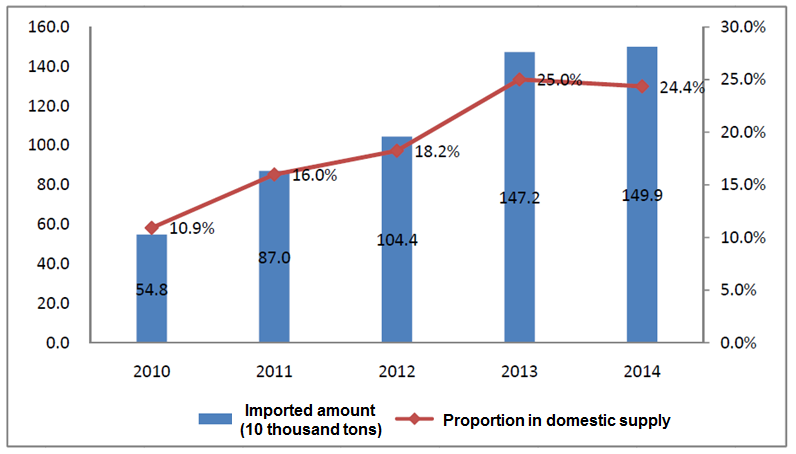
Figure 5 Imported amount and proportion in domestic supply of milk powder from 2010 to 2014
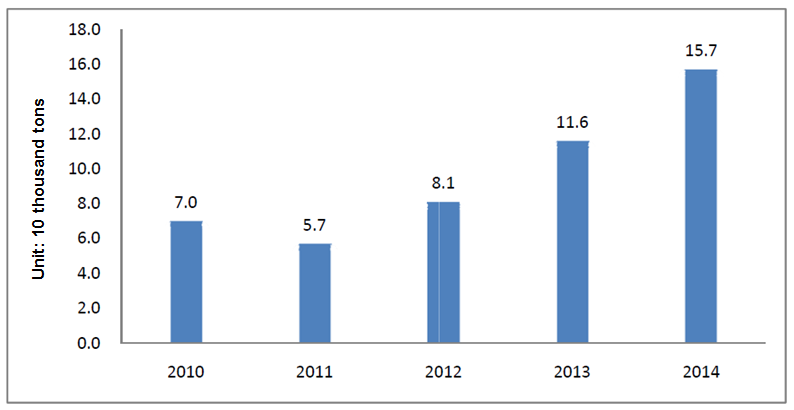
Figure 6 Imported amount of infant formula milk powder from 2010 to 2014
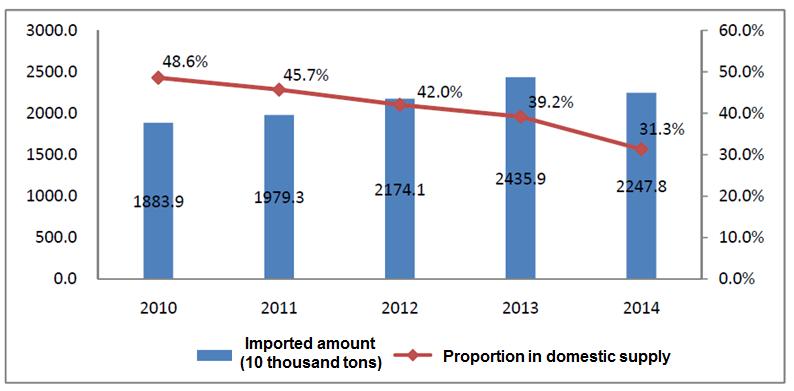
Figure 7 Imported amount and proportion in domestic supply of edible vegetable oil from 2010 to 2014
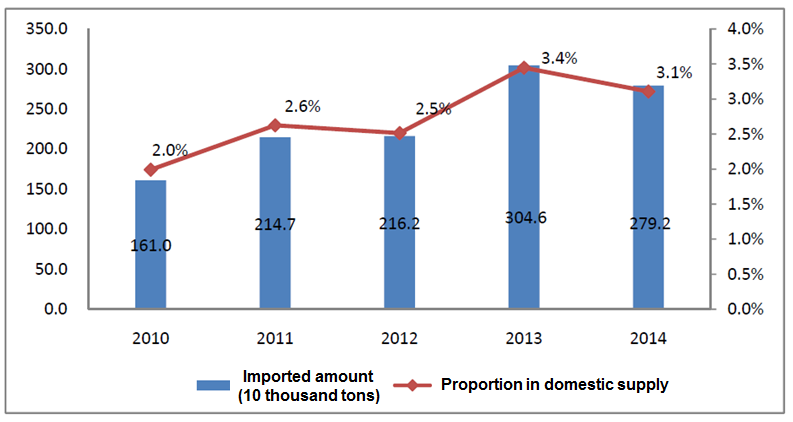
Figure 8 Imported amount and proportion in domestic supply of meat from 2010 to 2014
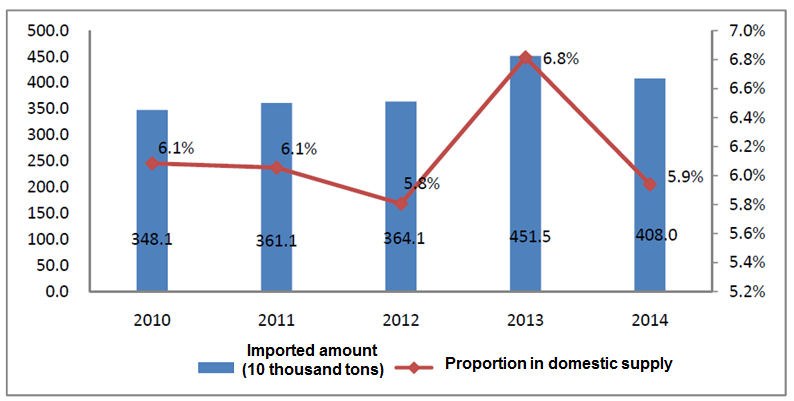
Figure 9 Imported amount and proportion in domestic supply of aquatic products from 2010 to 2014
2.Quality and safety report of imported food in China from 2010 to 2014
Over these years, the overall situation of the quality and safety of imported food in China has remained stable, without serious imported food quality and safety problems occurred. From 2010 to 2014, there were 1,692 batches, 1,857 batches, 2,499 batches, 2,164 batches, and 3,505 batches of unqualified imported food inspected each year by local CIQs, from 112 countries or regions. Among them, the main unqualified food categories were cake and biscuit, beverage, grain and products etc., and the reasons for unqualified imported food mainly included: microorganism, unqualified character, in-compliant food additives etc. More detailed information was indicated in the below figures (10-13).
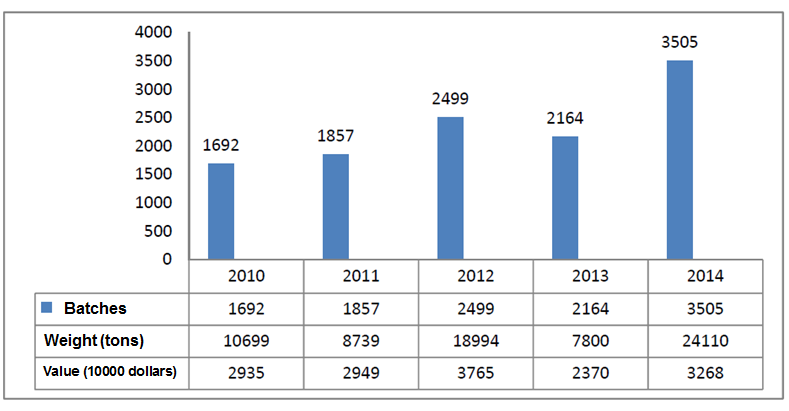
Figure 10 Unqualified imported food from 2010 to 2014
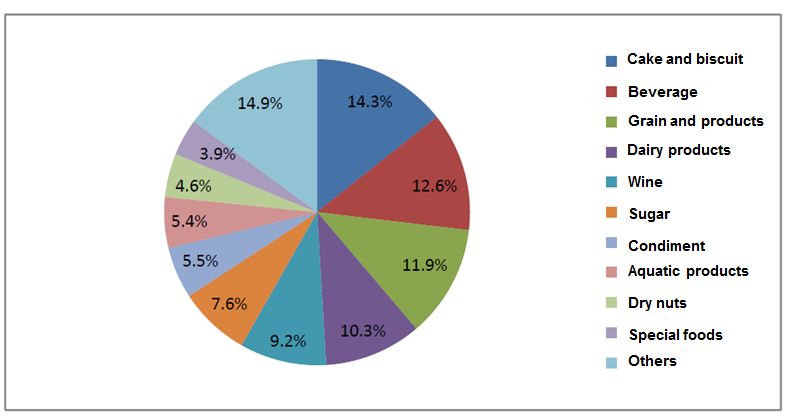
Figure 11 Unqualified imported food categories in China from 2010 to 2014(calculated in batches)
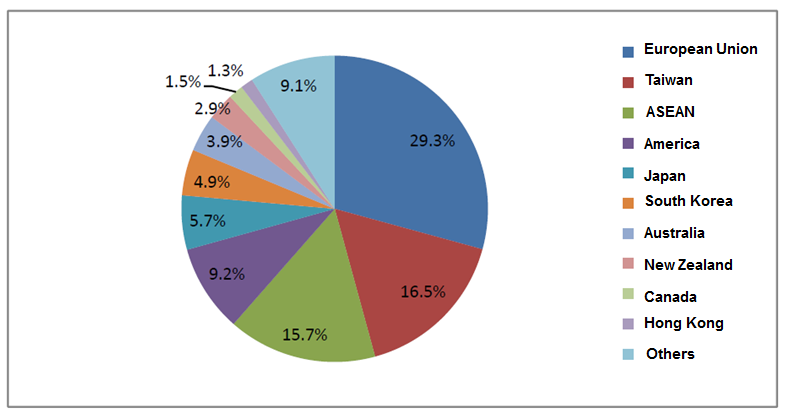
Figure 12 Sources of unqualified imported food from 2010 to 2014(calculated in batches)
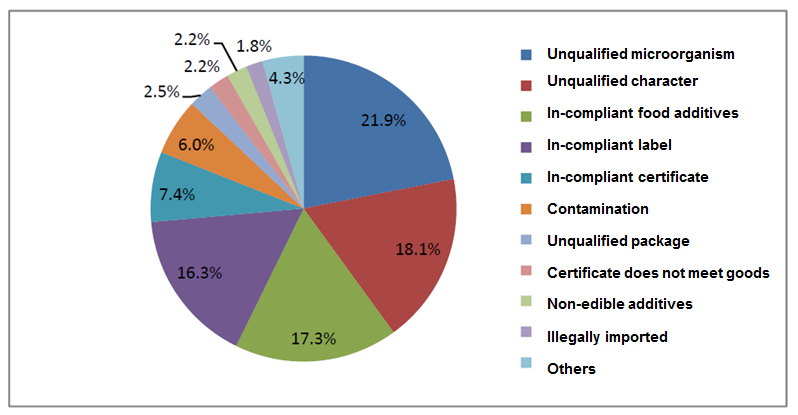
Figure 13 In-compliant reasons for the unqualified imported food from 2010 to 2014(calculated in batches)
The quality and safety of imported food in large amounts
1. The trade of imported food in China from 2010 to 2014
According to the statistics of AQSIQ, during the 5 years from 2010 to 2014, the trade volume of imported food in China nearly doubled, and the average annual growth rate reached 17.4%. In the 5 years, there were total 4,324,000 batches (140 million tons, 200.37 billion dollars) imported food inspected and quarantined by local CIQs.
During the 5 years from 2010 to 2014, China imported food from 213 countries or regions, among them, the top 10 in imported trade volume were: ASEAN, the European Union, America, New Zealand, Brazil, Canada, Russia, Australia, Argentina and South Korea, with a total value of 172.77 billion dollars, which accounted for 84.3 % of the total value; The imported food categories almost covered all kinds of global excellent foods, grease and oil, aquatic products, dairy products, meat, wine, sugar, grain and products, beverage, dry nuts and canned food are the main imported categories, with a total value of 192.14 billion dollars, which accounted for 93.8% of the total value. More detailed information was showed in the following figures (1-4).
Figure 1 The trade value of imported food in China from 2010 to 2014
Figure 2 Sources of imported food in China from 2010 to 2014 (calculated in trade volume)
Figure 3 Imported food categories in China from 2010 to 2014 (calculated in trade volume)
Figure 4 Import ports from 2010 to 2014
The trade of imported food in large amounts from 2010 to 2014
Among all kinds of imported foods, the imported amount of vegetable oil, milk powder, meat, and aquatic products reached 50.838 million tons, 5.434 million tons, 11.757 million tons and 19.328 million tons, respectively. More detailed information was showed in the following figures (5-9).
Figure 5 Imported amount and proportion in domestic supply of milk powder from 2010 to 2014
Figure 6 Imported amount of infant formula milk powder from 2010 to 2014
Figure 7 Imported amount and proportion in domestic supply of edible vegetable oil from 2010 to 2014
Figure 8 Imported amount and proportion in domestic supply of meat from 2010 to 2014
Figure 9 Imported amount and proportion in domestic supply of aquatic products from 2010 to 2014
2.Quality and safety report of imported food in China from 2010 to 2014
Over these years, the overall situation of the quality and safety of imported food in China has remained stable, without serious imported food quality and safety problems occurred. From 2010 to 2014, there were 1,692 batches, 1,857 batches, 2,499 batches, 2,164 batches, and 3,505 batches of unqualified imported food inspected each year by local CIQs, from 112 countries or regions. Among them, the main unqualified food categories were cake and biscuit, beverage, grain and products etc., and the reasons for unqualified imported food mainly included: microorganism, unqualified character, in-compliant food additives etc. More detailed information was indicated in the below figures (10-13).
Figure 10 Unqualified imported food from 2010 to 2014
Figure 11 Unqualified imported food categories in China from 2010 to 2014(calculated in batches)
Figure 12 Sources of unqualified imported food from 2010 to 2014(calculated in batches)
Figure 13 In-compliant reasons for the unqualified imported food from 2010 to 2014(calculated in batches)
The quality and safety of imported food in large amounts
| Food category | Quality and safety information |
| Dairy product |
|
| Edible vegetable oil |
|
| Meat |
|
| Aquatic products |
|
Chinese government pays close attention to food safety, and AQSIQ has established the supervision system covered all links of “before the import, during the import, after the import”. For import enterprises, they should pay more attention to the Chinese laws and regulations, and make sure their products are in compliance with Chinese regulations.
Contact us
Ms. Wing Yu, Food & Health Products, CIRS China
11F Dongguan Building, 288 Qiuyi Road, Binjiang District, Hangzhou, China, 310020
Tel: +86 571 8720 6538 | Fax: +86 571 8720 6533
Email: Wing.Yu@cirs-group.com